
Last Updated on January 24, 2024 by cscontents
Introduction
ELK stack or Elastic stack is a popular monitoring tool. It is the combination of 3 open-source software: Elasticsearch, Logstash & Kibana. ELK stack is popular for its log management & analysis capability, observability, etc. ELK stack can collect, store & analyze logs, and metrics data in real time.
Elasticsearch – It is the place where all the logs and metrics data get stored. Fundamentally, it is a distributed, search & analytics engine.
Logstash – It is a log processing tool. We can use Logstash to parse & enrich our logs.
Kibana – It is the data visualization tool in the ELK stack. Users can create visualizations & dashboards in the Kibana dashboard to get more insights about data.
Agenda of this article
In this article, we will discuss how to set up a production-grade ELK stack on a Virtual Machine (VM).
If you want to use ELK stack for your production environment where business-critical applications are running, you must ensure that your ELK stack setup is also capable enough to cope with the expectations of the production environment. You need to make your ELK stack production ready before you use the ELK setup for observability purposes in the production environment.
If you want to install or set up an ELK stack for lower environments or training/learning purposes, then you can follow the article below.
How to setup or install ELK stack on VM – a simple & practical guide
Prerequisite
Before starting, please check the below prerequisites.
Prerequisite Knowledge
- Experience with Linux commands usage.
- Hands-on experience in setting up ELK stack.
Prerequisite setup
- 2 virtual machines for 2 Logstash instances so that Logstash becomes highly available.
- 5 virtual machines for a highly available elasticsearch cluster and highly available Kibana dashboard.
- 1 load balancer where two Kibana dashboards will be configured in the backend.
- Network connectivity should be enabled between the machines over the required port.
Block Diagram of Production Grade ELK Stack
Below is a simple block diagram of a production-grade ELK stack.
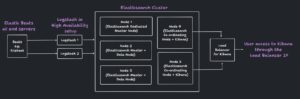
In the above diagram,
- 2 Logstash instance is used to make it Highly Available (HA).
- 5 node elasticsearch cluster
- 3 nodes are master eligible, and any one of them can be the master node at a time. Among these 3 nodes, 2 nodes will work as data nodes also.
- 2 nodes will work as Elasticsearch coordinating nodes, on these same nodes, Kibana is installed. To make Kibana Highly Available (HA), 2 instances of Kibana are used.
- Finally, one load balance is required to configure the 2 Kibana instances so that requests are being sent to both of these in a round-robin fashion.
The Elasticsearch configuration file of the 5 nodes in the Elasticsearch cluster will have the below lines.
Node – 1
node.master: true
node.data: false
node.ingest: false
Node – 2
node.master: true
node.data: true
node.ingest: false
Node – 3
node.master: true
node.data: true
node.ingest: false
Node – 4
node.master: false
node.data: false
node.ingest: false
Node – 5
node.master: false
node.data: false
node.ingest: false
Thank you.
If you are interested in learning DevOps, please have a look at the below articles, which will help you greatly.
- How to create ansible role for Java installation – a simple guide
- Kubernetes Series: Part 1 – Introduction to Kubernetes | Background of Kubernetes
- Kubernetes Series: Part 2 – Components of Kubernetes cluster | Kubernetes cluster in detail
- Kubernetes Series: Part 3 – What is Minikube and How to create a Kubernetes cluster (on Linux) using Minikube?
- Introduction to Ansible | High-Level Understanding of Ansible
- Basics of automation using Ansible | Automate any task
- 10 frequently used Ansible modules with example
- Jenkins Pipeline as code – High-level information
- What is End-to-End Monitoring of any web application and Why do we need it?
- What is “Monitoring” in DevOps? Why do we need to Monitor App/DB servers, Transactions, etc.?
- DevOps Engineer or Software Developer Engineer which is better for you?- Let’s discuss
- How To Be A Good DevOps Engineer?
- How to do git push, git pull, git add, git commit etc. with Bitbucket